Archive

Tag Archives: income

Screen Shot 2014-05-30 at 10.34.14 PM

A luxury house along “Billionaire’s Row” in San Francisco.

The failed economic policies of the Obama administration have been evident in measures of every important fundamental for six years now. Dismal job growth. High unemployment. Weak consumer demand, and so on. The biggest failure of the Obama administration was arguably the refusal to write down mortgage debt and force the top one percent of wealth holders to share some of the losses sustained during the housing market crash. While monetary policies pursued by the Fed, and a bailout of the secondary housing market with taxpayer dollars, temporarily provided a shot in the arm for housing prices, these gains were artificial. They weren’t based on genuine demand for housing by the majority of Americans. The result is that the top one percent of the U.S. housing market, the luxury segment, is booming, while the rest of Americans are having trouble affording homes. Now the housing market appears to be stalling out, except for luxury purchases by the elite whose wealth was protected by virtually every economic policy advanced through the financial crisis.

Screen Shot 2014-05-30 at 10.37.37 PM

A single family home in Oakland.

Let’s review the problem. In the 2000s the U.S. housing market was flooded with cheap credit. Lenders extended giant loans, many of them sub-prime, and the prices of houses shot upward in a bubble. But stagnating wages for American workers meant that the prices of real estate diverged from the reality of the ability of the average household to safely repay these loans. When the financial system imploded, the price of housing collapsed, and it was the borrowers who sustained the brunt of losses in the form of equity. The debt remained to be repaid, however, because Obama and his economic advisers chose to protect the wealth of the top one percent.

As economists Atif Mian and Amir Sufi have pointed out in their book House of Debt, the federal government could have taken over as the servicer of mortgage-backed securities and renegotiated millions of loans, dropping interests rates and principal balances. Or the government could have allowed bankruptcy judges to reduce mortgage debt burdens. The few principal reduction programs there were, like the Home Affordable Modification Program, could have been pushed much further. As is, programs like HAMP served only a small fraction of distressed borrowers with underwater loans. HAMP and other loan modification programs did not meet their original numerical goals.

By not making creditors share the pain of the collapse of real estate prices, the Obama administration enforced a giant wealth transfer from the majority of Americans to a small minority, literally the one percent who own the majority of stocks and bonds, particularly stocks in banks and mortgage servicing companies, and bonds backed by residential mortgage debt.

But the wealthy also cache their fortunes in non-housing related stocks and bonds, and the Obama administration’s quantitative easing program has been good for supporting the value of these securities. So the wealthy never took the same kind of hit the average American did with housing price dips and job losses. Then the wealthy benefited from federal programs that jacked up asset prices.

Should we be surprised then to learn that the top one percent of the residential housing market is booming while sales of literally every home priced below a luxury-grade are dropping? This is one consequence of the Obama administration’s housing and economic policies.

A new batch of numbers from the real estate research firm Redfin illustrates the consequences of the Obama administration’s economic policies by comparing the very top of the American real estate market to everything else. “Sales of the priciest 1 percent of homes are up 21.1 percent so far this year, following a gain of 35.7 percent in 2013,” writes Troy Martin of Refin. “Meanwhile, in the other 99 percent of the market, home sales have fallen 7.6 percent in 2014.”

“For the top 1 percent, the housing market is still booming. But for the rest of the market, the recovery is running out of gas,” concludes Martin. “As home prices have risen, wage and job growth have failed to keep up.”

Redfin’s research shows that in virtually every major metropolitan region the luxury segment of the housing market, the top one percent of homes in price terms, are selling fast and at higher prices. Not surprisingly, there’s considerable regional variation, but it’s a nation-wide phenomenon.

The real estate market in the San Francisco Bay Area is perhaps the most unequal and driven by sales to the super-rich. Luxury home purchases are way up in Oakland, San Jose and San Francisco, with Oakland and San Jose experiencing a virtual doubling of the luxury market over the past year. The top one percent of the market for Oakland, San Jose and San Francisco combined is priced at an average of $3.7 million, but San Francisco has pulled ahead of the rest of the nation with an average home price of $5.35 million for the top one percent of its market. Some of this is likely due to the booming tech sector which is creating thousands of millionaires in the region.

Screen Shot 2014-05-30 at 10.43.54 PMFor the majority of Americans the problem boils down to household debt. There’s still too much debt for the average household to sustain purchasing power that would drive an economic recovery, including a recovery in the housing market. From 2003 to the peak of the housing bubble in the third quarter of 2008, total household debt shot upward by about $5.4 trillion, according to data compiled by the Federal Reserve Bank of New York. From the peak of the housing bubble to the present, total household debt only decreased by $1.5 trillion. That means that about $3.9 trillion in debt piled onto U.S. households during the housing bubble is still weighing down family budgets. Most of this debt, about $2.89 trillion, was mortgage debt.

Over the same time period wages remained flat for most Americans. The median household incomes in the year 2000 was approximately $42,000. In 2012 it was about $51,000. Accounting for inflation, the real value of household income actually declined over this period by $5,000.

The income and wealth gains at the top of America’s economic pyramid over this same time frame should be familiar by now, as they have been extensively explained in recent research. What’s important to point out, however, is that the the average household, the median Americans whose incomes dropped by $5,000, took on significant mortgage debt during the 2000s, altogether in the trillions of dollars, and the lenders of this capital, ultimately, are the top one percent households.

So that’s why we see the luxury housing market booming while virtually 99 percent, the rest of America is stagnating.

In a recent profile story for the East Bay Express my colleagues Ali Winston, Elly Schmidt-Hopper, and I noted that Oakland mayoral candidate Bryan Parker doesn’t support a minimum wage measure that’s picking up lots of signatures, and which will likely be on the city’s ballot this fall. The measure would require all employers in the city of Oakland to pay their workers at least $12.25 per hour.

When we asked Parker about the minimum wage measure in an interview we weren’t surprised by his non-supportive answer. Parker is a business executive who ran a division of DaVita, a Fortune 500 healthcare company that pays many of its workers very low wages. Previously Parker worked at several investment banks, the sorts of places where conservative, anti-labor economic opinions are dominant.

But a few days ago on Twitter Parker claimed we misunderstood and mischaracterized his position on wages. He tweeted that he supports a “living wage.”

Picture 1To clear up the record, here’s what Parker actually told us. We asked him, “do you support a $12.25 an hour minimum wage such as the ballot measure that will likely be put to voters?”

Parker didn’t respond with a “yes.” Parker told us that he supports the idea of a “living wage,” but that he isn’t sure “what the right number is.”

He then said something rather dismissive of the entire idea of using government to raise wages for the working poor. “What I want to think about instead [of a minimum wage] is more full employment,” concluded Parker.

800px-History_of_US_federal_minimum_wage_increases.svg

The real value of the federal minimum wage has been made to decline since about 1968. This is one of the major causes of rising household income inequality in America. Ronald Reagan’s term in office coincided with the most consistent and effective attack on the minimum wage.

That’s supply-side economics at its most pure, and it’s also a talking point that has been used by opponents of minimum wages for decades. So to be really clear, when we asked about a minimum wage, we got an answer that wasn’t supportive, and that instead pointed towards a “rising tide lifts all boats” sort of plan.

Here’s the reason we likened Parker’s economic thinking to Ronald Reagan (see 1:33 mins in).

To be fair to Parker there’s some theoretical logic behind the full employment goal. In labor markets with lower unemployment rates companies have a harder time recruiting workers, even for the most unskilled of jobs. Tighter labor markets lead to rising wages as employers scramble to hire employees and retain them. Workers don’t fear quitting or losing jobs as they can just take another one. Wages tend to rise slightly during periods of low unemployment as workers have a smidgen of bargaining power.

Parker also told us he’s cautious about minimum wages because he believes they actually cause unemployment. “Employment would decrease,” said Parker. “Employers wont be able to afford as many employees. There’s extensive studies by economist showing that every time a minimum wage has been raised there’s been a deflationary impact on the overall jobs market.”

Again, that’s a very Reaganesque sort of statement. (See the above video link.)

Switching back into his business executive mode, Parker then told us that he’s a “data driven person.” This is why he doesn’t support a minimum wage and instead offers up the goal of growing jobs.

Problem is, a lot of the economic studies that claim to show a causal link between rising minimum wages and job losses are conducted by researchers working directly for pro-business, corporate-funded think tanks. When your paycheck comes from business interests who will profit from driving down wages, is it any surprise your findings are that higher wages for the lowest-paid workers are bad for the economy, even bad for those very workers?

For a recent example of this logic see Mark Wilson’s “The Negative Effects of Minimum Wage Laws.” Wilson’s consulting firm Applied Economic Strategies, LLC writes economic propaganda for the wealthy elite, attacking higher wages for workers, arguing that unions are obsolete, promoting tax cuts for the wealthy, among other policies that redistribute income and wealthy upward. Wilson was once employed by the Heritage Foundation, a think tank funded by ultra-conservatives like the Koch brothers and he served in George W. Bush’s administration. Oaklanders can probably expect some studies along these lines to be offered up this election season by local opponents of the minimum wage campaign.

The actual academic, peer-reviewed studies on the minimum wage don’t support Parker’s “data driven” opinions. Whether a higher minimum wage causes unemployment to rise at the bottom of the labor market is a controversial question that has been debated since Congress passed the first minimum wage law in the aftermath of the Great Depression, 1938. (It’s been debated alongside child labor laws — those opposing restrictions on using kids as workers in mines and factories were the same people opposed to mandated minimum wages.)

In fact, some studies show minimum wage increases actually bumped up employment rates.

Other state-level studies have shown that minimum wage hikes have led to job losses for low wage workers, but that the overall impact was still to redistribute hundreds of millions of dollars in income downward, even after accounting for lost income from fewer jobs, thereby improving the economic conditions of low-wage households.

A reason for the contradictory results, however, is that the minimum wage is an obviously political issue. It’s at the center of a power struggle between workers and businesses over the distribution of income from economic activity. Enacting minimum wage laws, or raising them on a statewide levels, or even in large metropolitan areas, causes the direct redistribution of millions in income from the top earners to the lowest paid workers. The net effect is probably to redistribute income from wealthy and middle class households to the poor, thereby lifting up the workers with the greatest needs. Many researchers who attempt to gauge the impact of the minimum wage on employment levels are already out to prove either the good or the bad in the policy. When researchers pick their methodological tools, data sets, and statistical formulas, it’s often the case that they’ve already subtly biased the outcome. The kinds of studies you trot out in support of your argument are just that; ammunition to support whether or not you’re for redistributing aggregate income downward via the minimum wage.

But overall the research —not just economic studies, also sociology, history, and not least the actual experiences of working poor families— is pretty clear. Minimum wages increase the overall share of income claimed by the bottom quartile or so of the workforce.

As the great California journalist Upton Sinclair once said, “it is difficult to get a man to understand something, when his salary depends upon his not understanding it.”

In my effort to show the Wall Street Journal’s tech reporter that real household incomes have declined in San Mateo County I dug up and sent a time series comparing 1999 to 2012. As the table below clearly shows, the median household income for Black families in San Mateo County declined by a staggering 27% over the last 13 years. For whites the decline was more modest, about 6% at the median.

What this means is that even the most privileged racial group which has the greatest educational and cultural capital is experiencing downward mobility in the epicenter of the tech boom. Blacks, Latinos, and other more marginalized groups have it a lot worse.

And of course these numbers don’t capture the families who moved out of San Mateo County because it has simply become too expensive, so they might even be conservative measures biased by displacement.

BlackWhiteMedianHouseholdIncomeSanMateoCo99-12I showed the WSJ’s Manjoo the above table. He responded via Twitter that he thinks it merely shows the effects of two recessions (2001 and 2007-2010). So the tech boom is unrelated?

He then stated that what matters, in his opinion, are the income gains experienced since 2010. In 2010 the national economic recovery began, and it coincides with the heating up of the latest the tech boom in Silicon Valley and San Francisco.

So what happens if we look at household incomes in San Mateo County since 2010?

We find yet again that most households are losing out, in spite of, or perhaps because of the tech boom.

MedianHouseIncomeSMCo2010-2012

reaganomicsA technology writer for the Wall Street Journal Farhad Manjoo has a defense of California’s tech industry in the current issue San Francisco Magazine. Manjoo’s core claim is that while northern California’s tech boom might be a source of problems like rising rental prices, and what he euphemistically calls a loss of “cultural diversity” (read: Black and Latino displacement), it’s still good for everyone in the Bay Area. It’s a trickle down economics argument, basically. To support his tech and wealth-friendly perspective Manjoo offers us what he says is a key economic stat, the “rising paychecks of workers in San Mateo County.”

Since Manjoo chose the words “paycheck” and “workers,” you’d think we can safely assume he’s trying to tell us something about the real incomes of the majority of the labor force in San Mateo County, the Bay Area’s tech epicenter. He’s not.

Perhaps because Manjoo is trying to portray the tech industry as a great economic engine creating jobs and wealth that trickle down to everyone he chose the Bureau of Labor Statistics’ County Employment and Wages Summary as the source for his “rising paychecks” stat. Here’s what he reported:

“At the end of 2011, according to the Bureau of Labor Statistics, people in the county just south of San Francisco earned about $81,000 a year on average. That’s a respectable figure—despite being a small, mainly suburban area, San Mateo had workers who were among the best paid in the nation. Then something extraordinary happened: Over the course of a single year, the county’s average pay shot up 107 percent. In the last quarter of 2012, San Mateo wage earners averaged about $168,480 a year. That made San Mateo by far the top-earning county in the nation[…]”

This is misleading and it undermines anything further Manjoo might have to say about economic inequality in Silicon Valley. Not that he tries to say anything substantively about it anyway. His article shrugs off growing inequality while offering up anecdotes and de-contextualized factoids he says show how tech wealth is being spread around.

To be fair, Manjoo does point out that the dramatic spike in wages in 2012 was due to the Facebook IPO which minted more than a few millionaires. That event skewed the county’s average upward.

But while the BLS wages statistic helps Manjoo talk about the princely incomes of the tech elite, it leaves his argument devoid of any accurate information about how income is actually distributed in San Mateo and the wider Bay Area. He ponders the lives of nomadic twenty-somethings who live out of their cars and spend their days trying to build startup companies in hackerspaces. He doesn’t spend any time thinking about half of the region’s workforce employed in low wage service sector jobs, amassing debt, afflicted by housing insecurity, with little promise of advancing. Without finding a stat to actually measure workers incomes he can say nothing of substance about the overall equity of the tech boom.

Given this fact you’d think Manjoo would ditch his unreliable “rising paycheck” statistic for something that actually measures the real earnings of the majority of workers, not wages as they’re defined by the BLS.

He doesn’t.

Instead Manjoo let’s these astonishingly high paycheck estimates stand with that little caveat about Facebook’s public offering. He then proceeds to claim that this skewed wealth creation over three months helped San Mateo rake in more tax dollars to fund local services, thereby lifting all boats. Then he rattles off that the county’s unemployment rate is at a seemingly healthy 5 percent. Finally he makes the following amazing claim for the entire Bay Area: “Every other local economic indicator—including per-capita income and employment in sectors outside the tech industry, as well as the aforementioned rental and real estate prices—is at or approaching an all-time high.”

That sentence is also very misleading and says nothing about human welfare. It’s like saying, because asset prices are high, and because lots of people are technically employed (forget their actual earnings or well-being) then the society is fine. It’s not.

But let’s just focus on income, the metric Manjoo never actually measured.

When he didn’t actually measure it he couldn’t say anything substantive about the situation of most workers in San Mateo, or the Bay Area today. Instead chose to make a Reaganomics argument about how enrichment at the top of society trickles down and benefits those at the bottom. Of course this isn’t true nationally, and every economic and social statistic, from real incomes to health outcomes demonstrates the suffering that growing inequality causes. The trickle down ideology holds no truer for the Bay Area if you actually look at people’s real incomes compared to the cost of living.

If Manjoo wanted to actually measure the paycheck of the average worker in San Mateo he couldn’t have picked a more misleading source. The BLS data he used to claim that the average worker earned $81,000 in 2011 is calculated as the mean average of all wages paid to every employee in San Mateo County covered by unemployment insurance. But in the BLS’s survey, wages are defined not just as cash in the form of wages or salary. The BLS includes “non-wage cash payments [including] employer contributions to certain deferred compensation plans such as 401(k) plans and stock options.” That’s the 2012 Facebook distortion right there. Manjoo recognizes this in his article, but he misses the significance of this technical note.

What Manjoo fails to see is that 2012 was only an anomaly in absolute scale. Otherwise every year in San Mateo the income figure reported by the BLS survey is greatly inflated by the over-sized compensation packages (that include yearly infusions of stock options) of the thousands of corporate executives who live there. Not only was the 2012 estimate of $168,480 skewed upward, the 2011 average of $81,000 which Manjoo calls a “respectable figure,” and which he assumes is normal, is also already skewed upward.

$81,000 would be respectable if it were a remotely accurate estimate of what workers actually earn in San Mateo on average, but it’s not. To understand what workers actually earn today in San Mateo a better source of information is the U.S. Census Bureau’s American Community Survey, 1-Year Estimate for 2012. For half of San Mateo’s labor force, wages fell below $41,274 in 2012.

What Manjoo avoids recognizing in his ode to the tech sector is that Silicon Valley is an extremely unequal place, and that this inequality is ripping apart the social fabric. Almost half of San Mateo’s households have incomes under $75,000 a year. Half of the county’s households —which average in size at 2.8 persons— subsist on an annual income that is well below Manjoo’s fictional average paycheck for a single worker.

HouseholdIncomeSanMateobyRace

Income distribution in the tech epicenter of San Mateo County is highly unequal. Black and Latino households are over-represented at the bottom the county’s income range.

There may very well be 40,000 households (15 percent) in San Mateo County whose income is above $200,000 a year and who are living very well. These are the tech executives, the private equity investors, and the lawyers and banker who work in San Jose, San Francisco, and the suburbs in between. Just the same there’s another 40,000 households that earn less than $30,000 a year. Many of these Silicon Valley denizens at the bottom of the hierarchy are Black and Latino families who live in the shadows of the region’s wealth and glory. Their struggles to survive are rarely reported. Instead “tech journalists” these days run around the Bay Area telling cute stories about killer apps and occasionally lamenting how the hyper-gentrification of San Francisco is paradoxically destroying opportunities for artistic and cultural consumption for the privileged techies. The real big story, however, is the massive redistribution of wealth and power to the top 5 or 1 percent, the shrinking of the middle class, and the immiseration of the bottom half of society.

Per capita incomes in San Mateo by race show us that the tech boom hasn’t been good for Black and Latino workers. While white workers make $63,000 per capita, Blacks make only $30,000 and Latinos even less with $20,000. Let that sink in. The per capita income for white San Mateo residents is double that of Blacks and triple that of Latinos. It’s well known that the tech sector is a white and Asian space, that the average software programmer or engineer is a young white or Asian male, and that the upper-most executive posts in tech and along Sand Hill Road (the finance capital for Silicon Valley) are filled with white men.

RaceGenderIncomeSanMateoWe also know that the tech boom is unequal in terms of gender. To jump right to the point, inequality in Silicon Valley follows a pretty typical pattern of racial and gender hierarchy in which white men rake in the biggest rewards by far, followed by white women and Asian men. At the very bottom of the income earnings distribution are Latinas and Black men. The median earnings for white men in San Mateo County are 200 percent higher than for Latinas. Half of all Black men in San Mateo earn less than $22,000 a year.

Of course only focusing on the socioeconomic statistics of San Mateo creates a skewed picture that itself doesn’t accurately reflect the changes being wrought on the Bay Area by the latest tech boom. The San Francisco Bay region is an integrated and inter-dependent economic unit of nine counties and dozens of cities. The tech sector is geographically concentrated in Santa Clara, San Mateo, and San Francisco Counties. These three counties also are home to the most affluent households in the Bay Area, so any income averages that don’t drill down to particular cities and neighborhoods will be biased upward and the growing poverty beneath the surface will be obscured. Any exclusion of Alameda and Contra Costa Counties —the East Bay where polluting industries are concentrated alongside hyper-segregated Black and immigrant communities— also creates a distorted picture of the Bay Area’s economic transformation.

Atmosphere

Part of San Francisco’s Union Square hyper-lux retail offerings, the De Beers store which features armed guards at the entrances. Ferrari recently opened a store a block away on Stockton Street. Haute Couture names obscure fill the district’s buildings offering items of conspicuous consumption.

Through the Financial Crisis and the Great Recession, inequality has intensified through income, housing, and public debt in the Bay Area. Black and Latino communities have lost wealth and power, while white and Asian communities have mostly to recovered. At the top, the wealthiest 5 to 10 percent, have made enormous gains.

Imagine a place where the hills are lined with the mansions of millionaire families, some of them billionaires. Their residences sit atop forested ridge lines with views of a peaceful ocean, or upon oak-studded peninsulas that jut into an azure bay. In this place they want for nothing. De Beers opened a retail store in one of their favorite shopping districts a few years ago, next to haute couture names like Bulgari, Cartier, and Gucci. An investment bank opened a “coffee shop” just a couple blocks from the headquarters of no less than seven Fortune 500 corporations, to catch their employees after work for talks over lattes about what to do with all that money crowding their bank accounts. Posh towers filled with luxury apartments sprout from the city center where multiple cranes seem to perpetually dot the skyline. iPhones pop from the palms of pedestrians like third hands, and newfangled apps like third eyes give them instantaneous information about the latest opulent consumer activities. Everything glows with money and power, a lot of it.

Below the hillsides glittering with wealth are even more expansive terrains of crumbling homes and apartment buildings —many foreclosed upon and awaiting some kind of financial death— packed with families that barely scrape together twenty thousand dollars a year to live on. Their views: smokestacks, port cranes, freeway overpasses, and scrap yards, or, sometimes on a clear day, if they ever think to pause from survival mode, they can see the hills, the mansions, the gleaming skyscrapers beyond reach, the towering campaniles of universities where they can never afford to send their children.

This place is characterized by the crowding of impoverished human beings, most of them of African and Latin American descent, into hollowed out industrial zones where factory buildings and abandoned warehouses echo the bustle of past decades. This economy of yesterday was exported to the new shop floors of China. Among the only things left are the toxic plumes of chemicals spreading slowly under fence lines. In this place entire generations face severe poverty and a decimated public sector – especially the schools. Tens of thousands of adults exist, persist, somehow without meaningful work or income. Tens of thousands of house-less persons —likely no longer even part of the statistical surveys used to calculate joblessness and income— wander the streets and sleep in the cracks of weathered concrete each night. Every few months the police slay a youngster under questionable circumstances. Crime is rampant. Violent crime is hard to avoid, part of the overall suffering.

The splendid heights and stratospheric wealth would not be so contemptible was it not hanging directly over such desperate poverty. Of course the two things are not unrelated.

Welcome to the San Francisco Bay Area, in the Golden State of California.

The West Coast financial center of the United States.

The epicenter of the tech industry.

The global vortex of venture capital.

One of the most brutally unequal places in America, indeed the world.

If measured by the same metrics that are used to gauge income inequality within nation states, the Bay Area’s internal divide between its rich and its poor would place San Francisco between China and the Dominican Republic, making it roughly the 30th most unequal state in the world. China is now the estimated home to 317 billionaires. California counts perhaps 90 billionaires. Half of these, mostly white men, live in San Francisco and Silicon Valley. The Census counted 4.2 million persons slipping below their definition of poverty last year in California.

In the distribution of income and wealth, California more resembles the neocolonial territories of rapacious resource extraction and maquiladora capitalism than it does Western Europe. Oakland is more El Salvador than it is EU. The Bay Area metropolis is more Bangladesh than Belgium.

California is just one of seven states that has the distinction of ranking higher than the national average on three basic metrics of income inequality, as measured by the Bureau of the Census. Its gini coefficient of income inequality was most recently measured at 0.47.

The ratio of income between the top 10 percent and the bottom ten percent, as well as the ratio of income between the top five percent and the bottom twenty percent show staggering divides in economic power that few other places in America, indeed the world, surpass.

IncomeIneqUSNeighborhoods2009

Source: Weinberg, Daniel H., “U.S. Neighborhood Income Inequality in the 2005-2009 Period,” American Community Survey Reports, U.S. Census Bureau, October, 2011.

The only states that compare to California’s harsh inequalities are deep southern states structured by centuries of racist fortune building by pseudo-aristocratic ruling classes, and the East Coast capitals of the financial sector.

StatesIncomeIneqCensus2009

Source: Weinberg, Daniel H., “U.S. Neighborhood Income Inequality in the 2005-2009 Period,” American Community Survey Reports, U.S. Census Bureau, October, 2011.

The economies of Louisiana, Mississippi, and Alabama remain bound by racial inequalities founded in slavery and plantation agriculture; the wealthy elite of all three states remain a handful of white families who control the largest holdings of fertile land, and own the extractive mineral and timber industries, and the regional banks.

Texas, with its sprawling cities, global banks, energy corporations, universities, and tech companies, is more like California in that its extreme economic inequalities are as new as they are old. Stolen land and racial segregation combine with unworldly new fortunes built on the Internet and logistical revolutions in manufacturing and markets to manifest a gaping divide in power and wealth between the few and the many. The Texas border, like California’s, opens up vast pools of Mexican and immigrant labor for super-exploitation by agribusiness and industry.

The same goes for New York, Connecticut, and Washington D.C. the other most unequal places in the United States. New York and Connecticut, like California, have become societies divided by an upper stratum of financial-sector workers and corporate employees whose salaries and investments simply dwarf the bottom half of the population’s earnings, and unlike the South, this extreme level of inequality is rather new in its source of valorization. Washington D.C. is split between the federal haves, mostly fattened contractors who run the military, or who represent the interests of the billionaires in California and New York, and the have-nots, mostly Black and immigrant service sector workers who wait on these technocrats of empire.

It’s a strange club, the super-inequitable states of the U.S. This exclusive list pairs the bluest coastal enclaves of liberal power with the reddest Southern conservative states. In terms of wages and wealth these places have a lot in common.

Picture 4

San Francisco’s real estate roller coaster. The Financial Crisis cut 20% off home values in San Francisco, but the U.S. Federal Reserve’s bond buying program, coupled with broader tax and fiscal policies, has created a rally in securities markets, handing the wealthiest Americans enormous gains in net worth. These economic policies benefiting the rich are evident in San Francisco’s real estate prices. Secondarily is the Tech 2.0 boom in San Francisco and Silicon Valley, pulling in thousands of new residents to work in Internet, biotech, and other industries where six figure salaries are the norm.

In San Francisco homes now routinely sell for millions. Not mansions. Not even particularly large houses. Just simple homes built decades ago. In most other markets they would fetch the national median home price of about $170,000. San Francisco, which locals like to call “the City,” sees dozens of real estate deals every month in which a cool million or two pass hands, and afterward the new owner, usually someone with freshly minted tech or finance money, has the modest structure demolished and scraped away. The new thing is to build upward, and lavishly, from scratch. Heated stone bathroom floors and wine cellars are popular. Securing a pad in Noe Valley or Bernal Heights for a few million is seen as a reasonable way to spend money.

In San Francisco the western end of Broadway is known as “billionaire’s row.” Quite a few of the side streets and parallel avenues like Jackson, Pacific, and Washington are lined with estates that trade hands on occasion for a few tens of millions. No tear downs here. The villas and manors along these avenues were built by sugar barons and banking tycoons of centuries past. Silicon Valley’s most senior executives, and the City’s hedge fund managers, buyout barons, bankers, and a few celebrities make up most of the neighborhood’s owners. Their children attend exclusive private schools in Pacific Heights where they are preened for Stanford and Princeton.

It is becoming hard to identify any part of San Francisco as an “elite” enclave. Tech 2.0, as the Google and Facebook-led regional boom is being called now, has vested thousands of twenty somethings as well as senior executives with billions in IPO cash and billions more in salaries to hunt for real estate, and they have chosen San Francisco, nearly all of it, as their preferred stomping grounds. Maybe it will only be another decade until Broadway starts getting called trillionaire’s row.

Picture 5

Sea View Avenue, Piedmont, California. 71 percent white, only 5 percent of Piedmont’s population is Black or Latino. Median household income is $200,000, and wealth holdings are much more. Piedmont supports its own public schools, police force, parks, and libraries.

Across the Bay is a slightly more modest version of billionaire’s row, probably better called a millionaire’s row running across the ridge line from Oakland north to Kensington. In the middle of Oakland, in fact completely surrounded by the scrappy industrial city by the Bay, is the city of Piedmont. When it was founded in the 1920s its first residents gave it the nickname “city of millionaires.” They restricted housing to single family residential homes on large lots from the start to prevent Black and immigrant families from moving up the hillside. Sea View Avenue is where the big money that wants to show off buys real estate, but the entire city boast a median home price of $1.4 million. The Berkeley hills are similarly rich and populated by an unusually high number of lawyers.

Lawyers, especially tort defense, corporate, and tax lawyers who serve the wealthy and defend corporate America from labor unions, environmentalist, and consumer advocates, also love Marin County. Across the Golden Gate from San Francisco, Marin is not much more than a bedroom community for corporate lawyers and CEOs who want a little more room and sun than San Francisco provides. If Piedmont was a city shelter to exclude the working class, then Marin is similar, but on the level of a county. Despite growing pockets of Latino poverty in older towns like Novato and San Rafael, Marin remains one of the wealthiest counties in the U.S. on a per capita basis. Marin’s Black population is segregated into the tiny Marin City, one of the only places public housing was allowed to be built. Marin City’s residents work in the retail sector and some of the industry along San Rafael’s waterfront. They earn near the bottom of the region’s wage scale and subsist on a fraction of the income their wealthy neighbors take in each month.

Picture 7

Hagenberger Road, East Oakland. Oakland is over 50 percent Black and Latino. Sections of the city such as the area pictured above are 90 percent non-white. In the typical pattern of environmental racism, residential homes are in close proximity to major roadways, highways, rail lines, industrial facilities, scrap yards, and utilities.

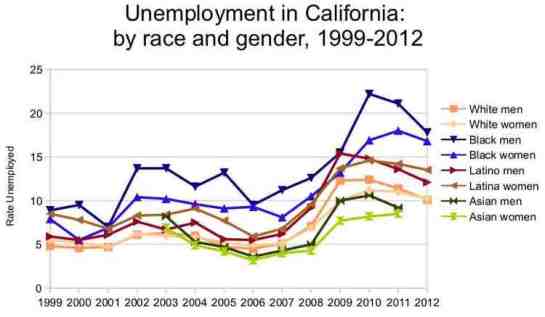
Unemployment stalks the working poor of the Bay Area, threatening to force them into insolvency and bankruptcy, foreclosure and displacement. During the first Dot Com boom of the late 1990s unemployment was at five percent for white Bay Area residents. For those living along the billionaire’s and millionaire’s rows, unemployment is a meaningless concept. The capital invested by the rich, by their clever advisers who run the hedge funds and private equity shops, earns interests and returns on equity far larger than any years honest wage labor can eek out. The tax code provides for this with carried interest and the lowest personal income tax rates for top earners in many decades. Hordes of tax lawyers, many who live in Marin, the Oakland hills, and San Francisco, will eagerly structure a family’s investments and bills to minimize taxes, so long as they possess a minimum of $5 million in liquid assets – preferably more.

Black men in the Bay Area have consistently suffered an unemployment rate double that of white men. Through the entire George W. Bush presidency, a period characterized by an economic policy to benefit the wealthiest with low taxes and interest rates, Black men endured double digit unemployment rates, reaching about 13 percent when Obama took office. The Financial Crisis sent Black unemployment rates skyrocketing in San Francisco, Oakland, Richmond, and Vallejo, upwards of 22 percent in 2010.

UnemploymentCAbyRace1999-2012Economic policies under Obama —both those he championed, and those he compromised on— have been very good for the wealthy, and that’s reflected best by the real estate and consumption bubbles frothing over places like San Francisco. The Federal Reserve Bank’s unprecedented purchases of bonds and its low lending rates have produced rallies in stock and debt markets which have greatly re-inflated the fortunes of the rich.

Pew_Uneven_RecoveryThe Pew Research Center recently summed up this polarizing redistribution of wealth from the bottom to the top by noting simply that since 2009 the wealthiest 7 percent of Americans experienced an increase of 28% in their net worth, while the bottom 93 percent actually lost 4 percent of their savings.

The San Francisco Bay Area’s current tech boom is further dividing the wealthy few from the impoverished masses. Companies like Google, Apple, and Oracle are among the least diverse workplaces places where men outnumber women, and white and Asian employees dominate the ranks of lowly programmers and senior executives. The need to hire thousands of engineers is drawing waves of college graduates to Silicon Valley and San Francisco, and they’re washing over the current residents like a tide of suffocating oil. Some of the tech buses —private transit systems operated by Silicon Valley’s largest firms to shuttle employees from San Francisco to their suburban campuses in Santa Clara County— now run lines into Oakland and Hayward, a sign that their employees are increasingly colonizing formerly undesirable zones of real estate.

The drift apart between the pale wealthy few and the impoverished multitudes of darker-skinned peoples is evident on the level of whole cities. San Francisco enjoys robust public finances, high credit ratings, low per capita debt to income ratios, and many well funded public services. However, two decades of intense gentrification mean that this healthy public sector increasingly caters only to those “citizens” who can afford to live in San Francisco.

Pushed out of the region’s urban core, in the 1990s and 2000s Black, Latino, and some Asian immigrants found themselves in the affordable locales of Vallejo, Stockton, Richmond and Oakland. Further out towns like Antioch, Brentwood, and Pittsburg became increasingly non-white and working class. In the Financial Crisis these cities hemorrhaged residents and revenues due to some of the highest foreclosure rates in the nation. Vallejo and Stockton went bankrupt after slashing the most basic services. Vallejo is 75 percent non-white. Stockton is 80 percent non-white.

The wealthiest Bay Area communities, the “towns” of Hillsborough, Woodside, Atherton, Los Altos Hills, and the city of Piedmont are three quarters white with median incomes in the six figures. Public finances barely flinched during the Great Recession. A few of these local governments in fact have no outstanding public debt.

Atherton and Los Altos Hills have zero bonded public debt.

Oakland has almost a billion just in bonded debt.

In the tony Marin hamlet of Fairfax the public debt burden resting on each resident is about 1.7 percent of their annual income.

In Richmond the ratio of public debt to personal income for each resident is 16 percent.

Richmond, a quarter Black and a third Latino, is a tangle of oil and chemical refineries run primarily by Chevron. Not a year ago a massive fire at one of the company’s plants spewed toxic vapors and smoke into the sky, poisoning thousands of residents.

Chevron is headquartered in San Ramon, another exclusive, mostly white suburban environment with low municipal debt and a household median income of $121,000 a year.