An article from the the San Francisco Call, October 15, 1899 describes Henry Dussen and his family, “in a tattered tent located on 16th street and Portrero avenue they shivered last night, supperless, except for a meal of potatoes, half cooked for lack of fire.” In 1899 San Francisco was home to many other impoverished families like Dussen’s, but also home to multi-millionaire railroad barons, sugar plantation masters, and bankers.
What’s the most unequal county in California? Maybe it’s Yuba. Or maybe Siskiyou. Or is it Los Angeles. Depends how you measure it.
One simple means of gauging inequality is to compare household income levels at the top of the income distribution to the bottom of the income distribution.
At the bottom of the income distribution are the very poor. Members of very poor households are more likely to have high levels of debt, and to experience unemployment and under-employment. Some of these very poor households subsist on fixed incomes from pensions or social security. Very poor households likely have a hard time paying rent and bills. They likely pay much higher percentages of their income to live in substandard housing; they send their kids to under-funded public schools; they have a difficult time obtaining health insurance; they pay more for credit and other financial services, and so on.
Then there are rich households. Rich households are more likely to live in clean and safe neighborhoods and cities; they send their kids to well-funded public and private schools; and their housing and other needs don’t consume all of their income. They can save and pass on wealth to their children.
Using reported household income data from the U.S. Census (American Community Survey, 2013 3-Year Estimates), I’ve categorized households into the following five categories by income for each county in California:
Very poor – Less than $49,999
Working class – $50,000 to $99,999
Middle class – $100,000 to $149,999
Upper-middle class – $150,000 to $199,999
Rich – $200,000 or more
You can object to how I’ve categorized and labeled different income ranges, but the point isn’t sociological perfection. This is a rough attempt to simplify some data and make some big picture comparisons regarding income inequality across California’s 58 counties.
Keep in mind that “very poor” and “rich” don’t refer to wealth for the sake of this discussion. These categories only refer to reported household income.
Also keep in mind that what I’m doing here is taking a very blunt measurement of inequality to compare counties to each other. One problem with using this census data is that everyone earning above $200,000 is lumped into one category (the one that I’m calling rich). There’s a big difference (two orders of magnitude to be exact) between earning say $200,000 and $20,000,000, and this is entirely lost in this Census data, so we have no idea what the gross incomes for each county are, and what the gross incomes of the top 1% or 5% really are compared to the rest of the population.
Even so, there’s some interesting patterns in the tables.
Below is a table that breaks down each county’s households into the five categories. The counties are then sorted by a simple measurement – the quotient of very poor households to rich households. Take for example Yuba County which has a quotient of 64 —the highest score of all counties. This means that for ever 1 rich household making above $200,000 a year in income, there are 64 households that are very poor, making less than $50,000 in yearly income. At the bottom of the table is Marin County where there are 2 poor households for every 1 rich household.
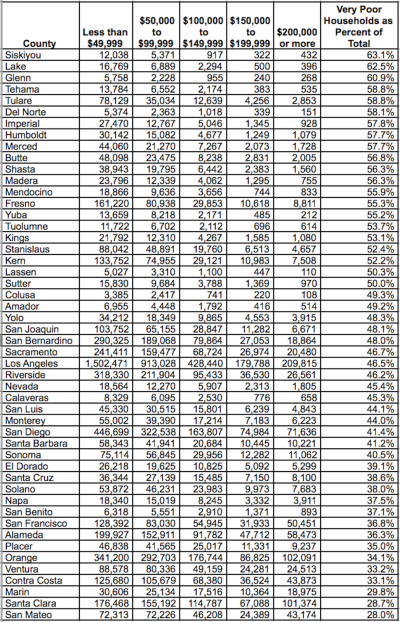
What jumps out when inequality is measured this way is that California’s Central Valley and other rural areas have big numbers of very poor households and very few rich households. By comparison the major urbanized areas have more rich households. And the six major counties of the Bay Area (Marin, San Mateo, Santa Clara, San Francisco, Contra Costa, and Alameda) all have the lowest very poor to rich household quotients.
Keep in mind that this doesn’t mean that the Bay Area is without very poor households. Alameda County, for example, has about 200,000 very poor households compared to 58,000 rich households, a quotient of 3.4. Yuba County, at the other end of the table, has only 13,600 very poor households even though it’s quotient of very poor to rich households is much higher.
If we re-sort the table by a different metric, the percent of poor households to the total number of all households, then Siskiyou County jumps to the top of the table. 63 percent of households in Siskiyou County are very poor. Again at the other end of the table are the six population centers of the Bay Area, with relatively low percentages of very poor households, ranging from 28 percent in San Mateo to 37 percent in San Francisco.
A final way to look at these numbers is to simply see which counties are home to largest sheer numbers of very poor households and rich households. Here it’s no contest. Los Angeles County is home to about one in every three very poor households. LA is also home to about one in every five rich households. Not surprisingly, this table largely follows the general population rankings of California’s counties.
So what’s the most unequal county in California? Well it’s probably not best to use this type of Census data to figure that out. The above tables point more toward concentrations of low income and high income households, but because the data doesn’t measure the actual amounts of income being earned (especially top incomes) it’s impossible to say just how unequal these places really are.
I’ll try to zero in closer to an answer in a subsequent blog post.


