
State of Inequality, Part 2
The counties encompassing Silicon Valley and San Francisco are among the most unequal places in California and the entire United States, according to income tax statistics published by California’s Franchise Tax Board. The same data set shows that rural regions, the major population centers of the Central Valley, and the outer-ring suburbs of LA and northern California’s East Bay are less unequal in terms of the distribution of income.
National-level data (from 2012) reveals that the top 1 percent of income earners claim just above 20 percent of the entire national income. In California for the same year, the top 0.5 percent of income earners claimed 20 percent of the entire state’s income, making California more unequal than the rest of the U.S.
Californian’s earning above $400,000 (roughly equal to the national average income level of the top 1 percent) account for 1.7 percent of California’s population, but they claimed $349 billion of the state’s total income. That’s equivalent to 30 percent of the state’s entire income.
At the other end of the spectrum in California are workers, retirees, students, and other low-income persons who claimed less than $49,000 in income in 2012. These 9.5 million people, equal to 60 percent of the state’s total population of tax filers, claimed only 17 percent of the total income pie. (See the graphs below; aggregate dollars in thousands; numbers not equal to state’s population, but instead the population of tax filers; some tax filers filed jointly; other caveats apply.)
 By far the most unequal counties in California are those that encompass the deliriously wealthy cities of Silicon Valley. San Mateo County appears to be the most unequal county due to a concentration of super-high income earners in places like Atherton, Woodside and Menlo Park, alongside a cluster of very low income individuals who live mostly in places like San Bruno and South San Francisco. It’s poverty amid spectacular plenty.

Larry Ellison, who was paid $96 million in 2012, describes something very small, perhaps the reported income half of San Mateo County’s residents earned the same year. Ellison’s San Mateo County residence, in Woodside, cost $200 million to build.
In San Mateo the top 3.6 percent claimed over $18 billion in income, or 48 percent of the county’s total income pie. Meanwhile the bottom 48 percent made by with only $3.6 billion in income split among themselves. For the bottom 48 percent the mean income level was $22,000. The top 3.6 percent had a mean income of $1.5 million.

San Francisco isn’t far behind in terms of extreme income inequality. The top 2.8 percent of San Francisco’s income earners claimed 39.8 percent of the county’s total income. The bottom 52 percent made by with a collective share of just 11.3 percent of the total income, giving them a mean income of about $23,000 compared to the mean income of $1.5 million for the top 2.8 percent.


Facebook CEO Mark Zuckerberg points in the direction of his net worth. Does he live in Santa Clara County, or San Francisco? From which county does he file his personal tax return? He has houses in both counties. His income in 2012 included $770,000 in salary and bonuses from Facebook, putting him comfortably in the top 1%. Of course it’s the Facebook stock and options he’s amassed that makes him truly wealthy, therefore today he only claims $1 a year in pay.
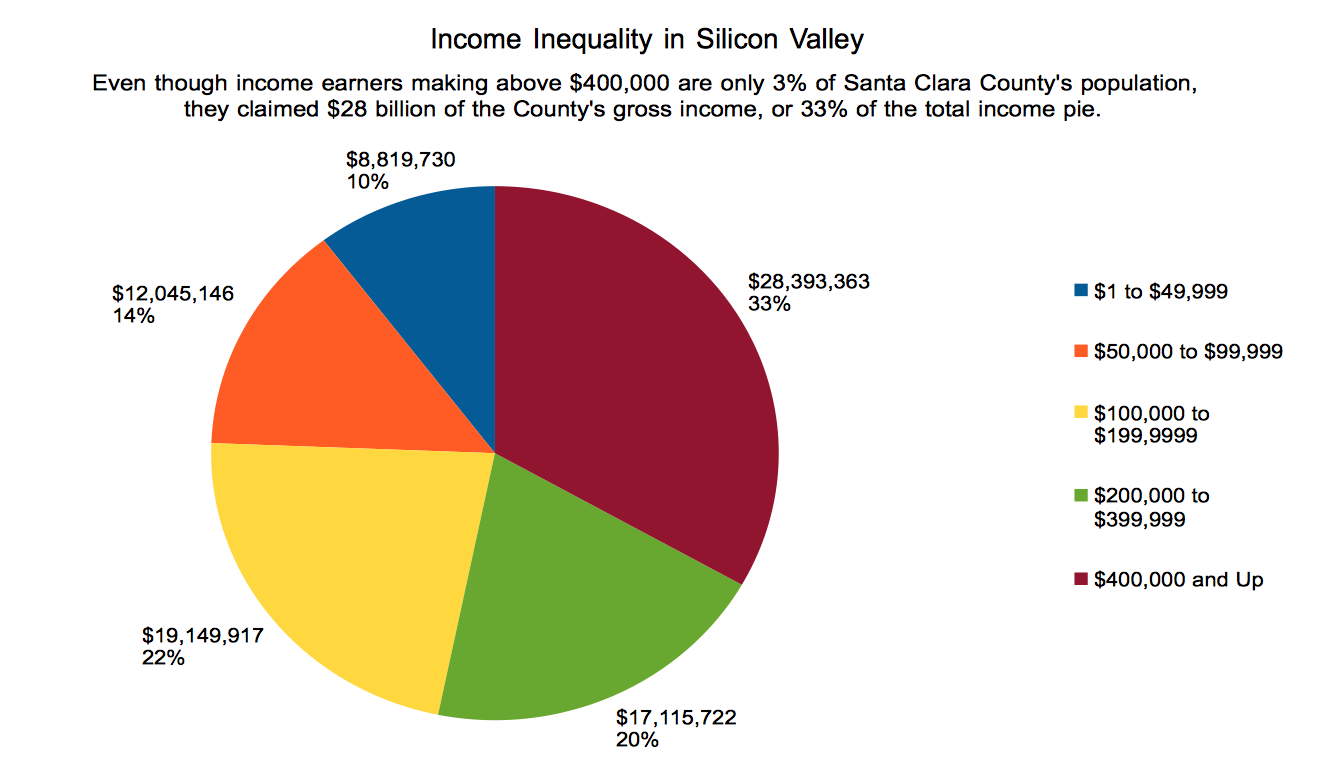
Santa Clara County is similarly riven with extreme income inequality. Those making $400,000 and up claimed 33 percent of Santa Clara County’s total income pie, even though they only accounted for 3 percent of the county’s taxpayers.
In Los Angeles and Alameda counties the income distributions look different due to several factors. First is the sheer concentration of very poor people in these counties, in numbers exceeding San Francisco and San Mateo. LA and Alameda counties also have somewhat larger middle classes that claim bigger shares of the total income pie. Even so, these counties are still dramatically unequal. In Los Angeles, for example, the top 1 percent claims $68 billion in income, equal to 27 percent of the county’s total income pie. The bottom 66 percent claims less than the top 1 percent: $56 billion, or a share of 22 percent of the total.

Other major population centers such as the Inland Empire and Fresno and Kern counties in the Central Valley appear to be less unequal in terms of income distribution. For example, in San Bernardino County the super-rich (those claiming above $400,000 a year in income) only took 5.6 percent of the total income pie. In Riverside it was 7.7 percent. In Fresno the top 0.6 percent took 13 percent of the total income pie, and in Kern it was 11.8 percent. Sacramento’s richest families in terms of income claimed 7.9 percent of the total income pie.

